L'énoncé
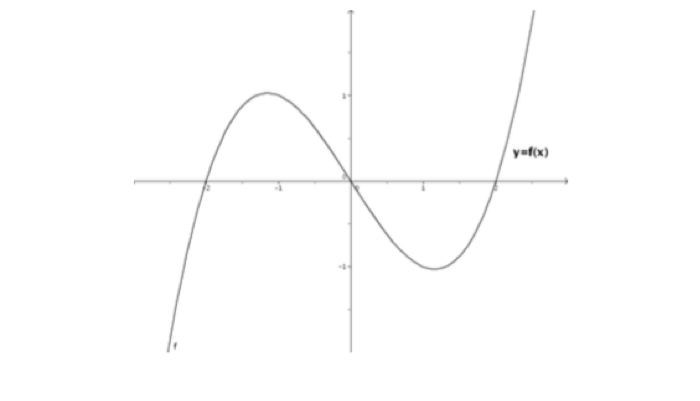
La représentation graphique d’une fonction est la suivante :
Question 1
Représenter grossièrement (et justifier) le graphique de la dérivée $f'(x)$.
Pour cela :
- On analyse la croissance de la fonction.
- On note les maximums et minimums.
- On analyse la concavité et convexité de la fonction.
- On note des points d’inflexion.
- On extrait des conclusions pour $f'$ à partir des informations obtenues pour $f$.
En analysant le graphique on déduit les informations suivantes :
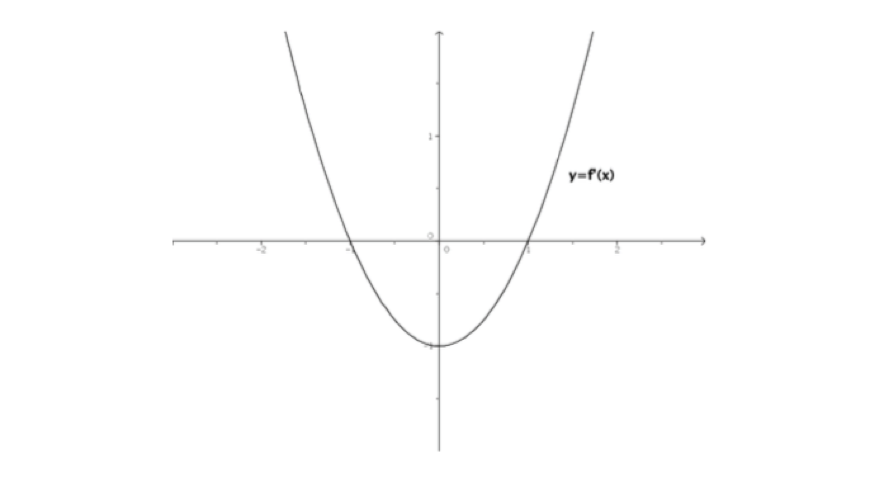
$f$ est croissante en $ ]-\infty; 1[ \cup ]1 ; +\infty [\Rightarrow f’(x)> 0$ dans cet intervalle.
$f$ est décroissante en $]-1 ; 1[\Rightarrow f'(x)< 0$ dans cet intervalle.
$f$ a un maximum en $]-1 ; 1[\Rightarrow f'(-1) = 0$
$f$ a un minimum en $]-1 ; 1[\Rightarrow f’(1) = 0$
$f$ est convexe en $]-\infty; 0 [\Rightarrow f''(x) < 0 \Rightarrow f'(x)$ est croissante sur $]-\infty ; 0 [$
$f$ est concave en $]0; +\infty [\Rightarrow f''(x) > 0 \Rightarrow f'(x)$ est décroissante sur $]0; +\infty [$
On conclut qu’il y a un point d’inflexion en $x = 0$, donc $f’$ admet un minimum en $0$.
Avec ces informations on peut tracer le graphique suivant :